
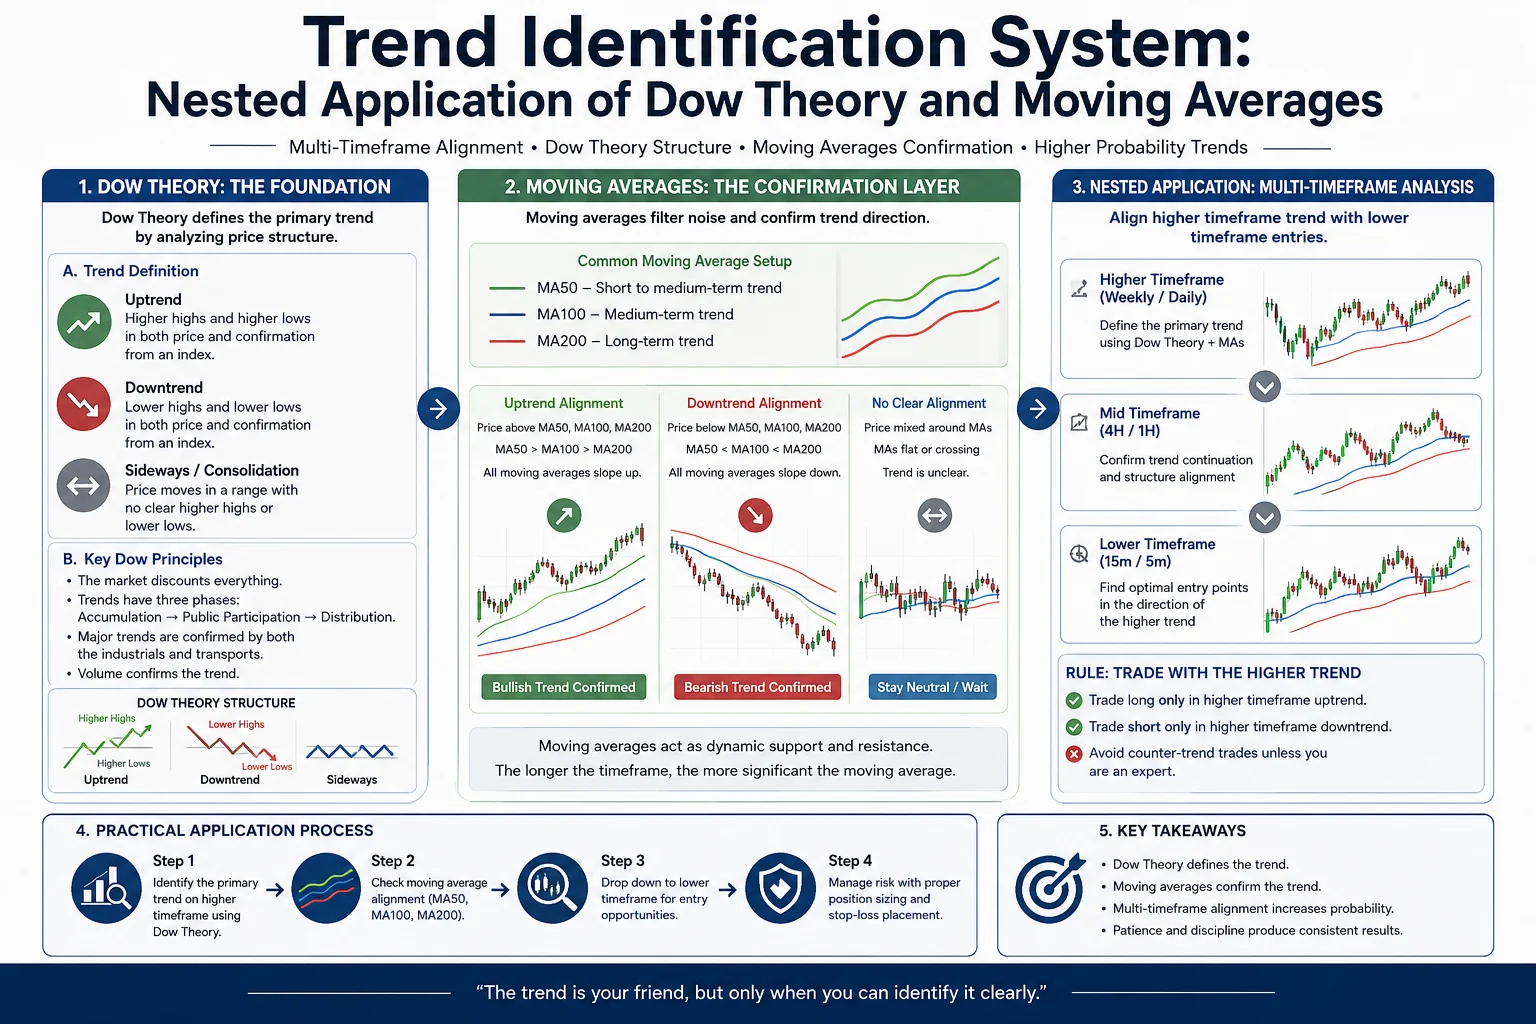
In financial markets, one of the biggest mistakes beginners make is not the inability to use indicators, but the failure to truly understand what a trend actually is. After entering the market, many traders constantly search for so-called “perfect indicators,” “explosive breakout signals,” or “precision bottom-fishing entries.” However, professional traders focus on a completely different question first:
Because once the direction is wrong, even the most accurate entry points will eventually be overwhelmed by the trend itself. Trend analysis must always come before trading execution. Every stable trading system is ultimately built around one core principle:
The Core Definition of a Trend
The classical definition of a trend originates from Dow Theory, developed by Charles Dow. An uptrend is defined by:
- Higher highs
- Higher lows
A downtrend is defined by:
- Lower highs
- Lower lows
A trend is never determined by a single candlestick. It is the continuation of market structure over time. One of the most common beginner mistakes is assuming that a strong rally immediately means a trend reversal, or that one sharp decline means the market has collapsed. In reality:
Market Structure Illustration
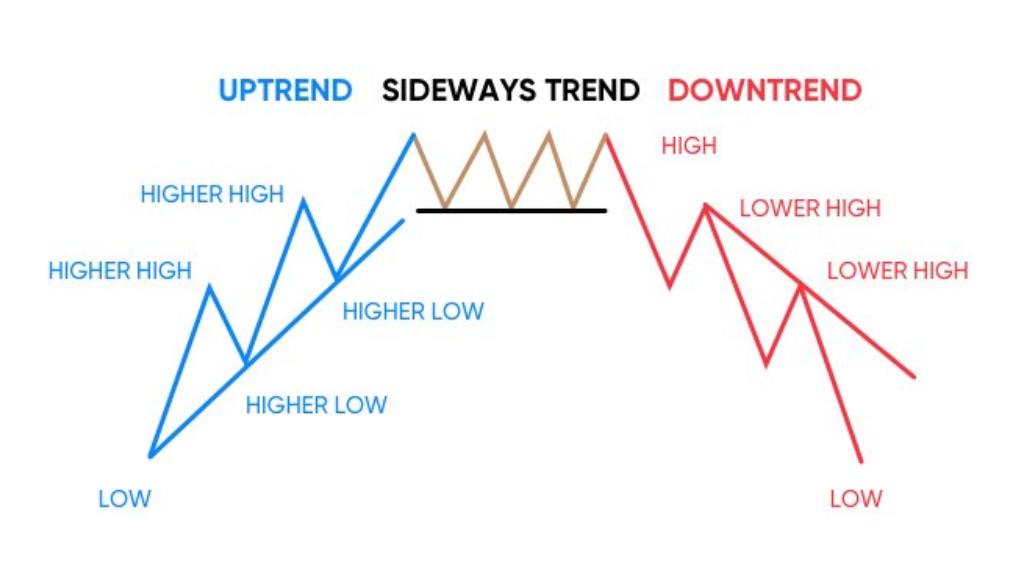
In a true bullish trend:
- Pullbacks do not break previous lows
- Each rally creates a new high
- Buyers continuously push average cost upward
In a bearish trend:
- Rebounds fail to break previous highs
- New lows continue forming
- Sellers maintain control of market direction
This is why professional traders never buy simply because “price has already dropped a lot.”
Moving Averages: The Dynamic Axis of Market Cost
After understanding structure, the next question becomes:
This is where moving averages become one of the most important tools in market analysis. A moving average essentially represents:
For example:
- 50-day moving average = average price over the last 50 candles
- 200-day moving average = average price over the last 200 candles
Therefore, moving averages primarily reflect:
Why the 50-Day and 200-Day Moving Averages Matter
These two moving averages are widely followed because:
- The 50-day moving average reflects medium-term institutional cost
- The 200-day moving average reflects long-term market cost
Large institutions, hedge funds, and quantitative trading systems heavily reference these levels, which gradually turns them into important market consensus zones. A classic bullish structure usually includes:
- Price trading above the 200-day moving average
- The 50-day moving average above the 200-day moving average
- Both moving averages sloping upward
A bearish structure usually includes:
- Price trading below the 200-day moving average
- The 50-day moving average below the 200-day moving average
- Both moving averages sloping downward
However, the most important factor is not simply whether price is above or below a moving average.
Moving Average Slope: The True Core of Trend Direction
Many beginners only ask: “Is price above the moving average?” Professional traders ask a much more important question:
Because:
If moving averages continue rising upward:
- Average market cost is increasing
- Buyers are willing to pay higher prices
- Capital continues flowing into the market
- Bullish momentum strengthens
If moving averages continue sloping downward:
- Market cost is falling
- Capital is exiting the market
- Bearish pressure increases
This is why:
This principle forms one of the foundations of many quantitative trading systems.
Nested Application: Market Structure and Moving Average Systems
Many beginners become excited whenever they see a moving average crossover. Professional trading systems, however, never rely on indicators alone. A reliable trend system requires:
A strong bullish trend usually requires three conditions:
Structure Confirmation
- Higher highs
- Higher lows
Moving Average Confirmation
- 50-day moving average above the 200-day moving average
- Both moving averages sloping upward
Price Confirmation
- Price consistently holding above the 50-day moving average
Only when all three conditions align can a trend be considered structurally reliable. Many false breakouts fail because indicators generate signals while the actual market structure never truly changed. Therefore:
Support and Resistance: The Logic of Flip Zones
One of the most important concepts in technical analysis is:
- Support
- Resistance
However, professional traders focus more on:
This is known as a:
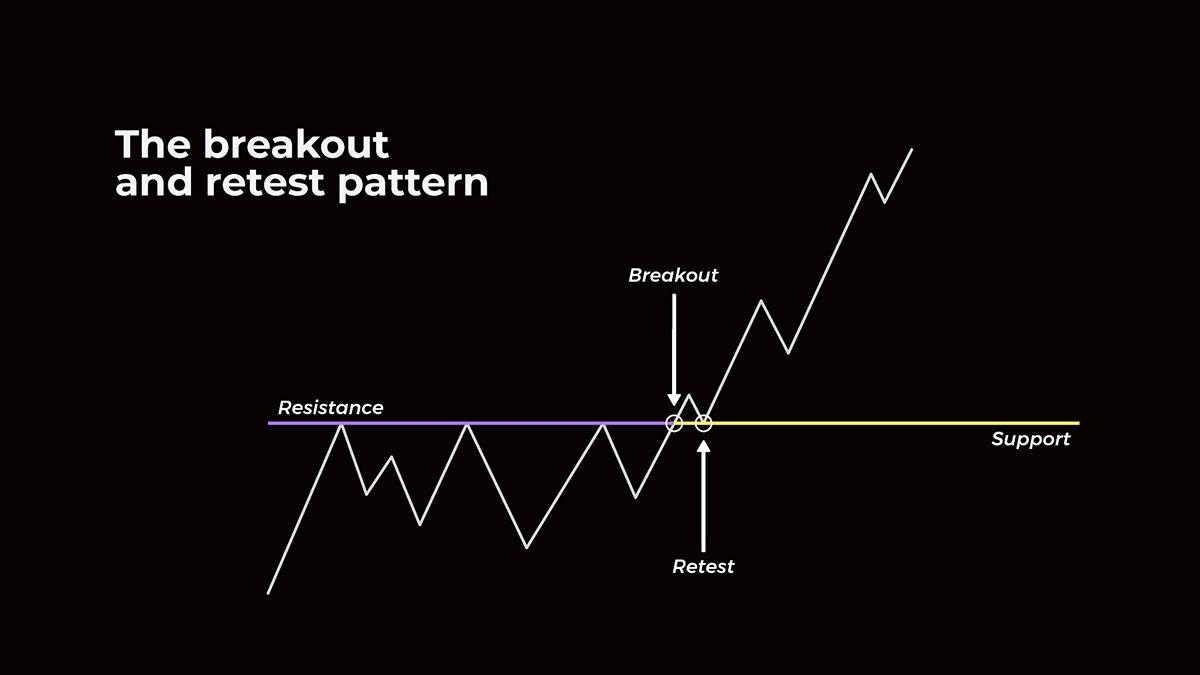
For example: A market repeatedly fails to break above a resistance level. Eventually price breaks above it. Later, price returns to retest the same area. Very often:
- Old resistance becomes new support
This indicates:
Professional traders rarely chase breakouts aggressively. Instead:
Because retests usually provide:
- Lower risk
- Better structure
- Stronger confirmation
Flip Zone Illustration
Multiple Timeframe Analysis
Many traders correctly identify direction but still lose money because:
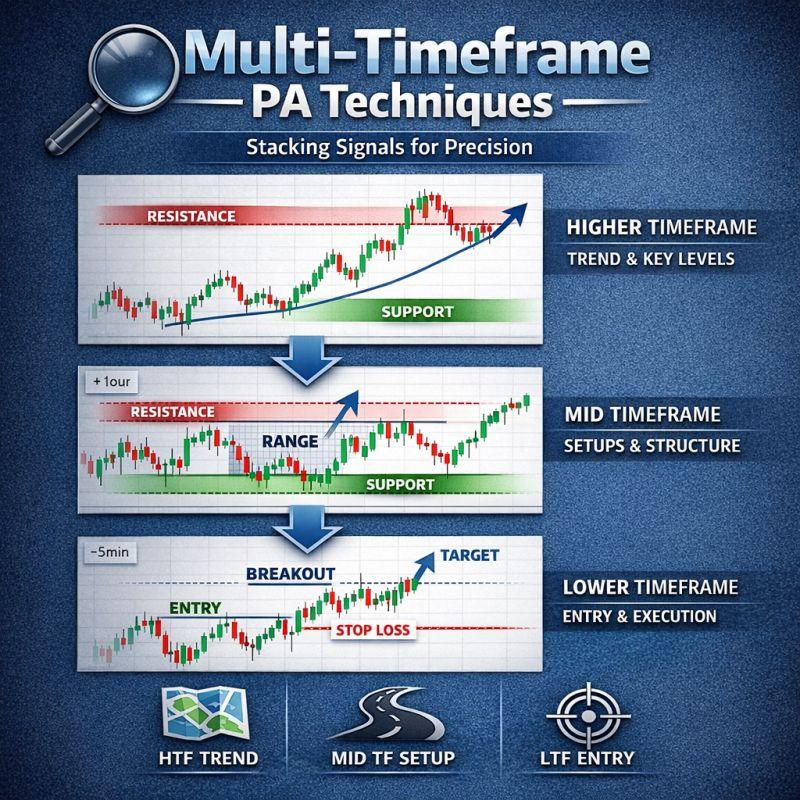
Professional multi-timeframe analysis follows a simple logic:
Higher timeframe determines direction
Lower timeframe determines entry
For example:
- Daily chart remains bullish
- Lower timeframe shows a temporary pullback
Professional traders will usually wait for:
True trading is not about prediction.
Multiple Timeframe Illustration
The Most Dangerous Beginner Behavior: Counter-Trend Buying
One of the most common beginner mistakes is continuously buying into a falling market. Many traders see large declines and immediately assume: “The market is already cheap.” Then they:
- Add more positions
- Average down repeatedly
- Continue buying every dip
However, if:
- The 200-day moving average continues sloping downward
- Weekly structure remains bearish
- Market cost continues declining
Then:
Professional traders always follow one principle:
Harwardia Academy Suggestions for Beginners
Harwardia Instituta of Quant strongly recommends that beginners avoid studying too many indicators at the beginning. Because:
The most important foundational tools are only:
- Market structure
- 50-day moving average
- 200-day moving average
Even spending one full year mastering only these three concepts is often far more effective than memorizing dozens of indicators.
Suggestion One: Never Trade Against the 200-Day Moving Average
If price remains below the 200-day moving average:
- Reduce long exposure
- Respect bearish structure
- Prioritize trend alignment
Because:
Suggestion Two: Focus on One Market at a Time
Many beginners simultaneously study:
- Gold
- Bitcoin
- Stocks
- Forex
- Altcoins
Eventually they master none of them. The academy strongly recommends:
Because trading is fundamentally:
Suggestion Three: Build a Trend Observation Journal
Record the following every day:
- Are highs and lows still rising?
- Is the 50-day moving average rising?
- Is the 200-day moving average rising?
- Is price near support, resistance, or a flip zone?
Over time, traders gradually develop:
Final Core Principle
Always remember this principle:
Because:
- Candlesticks can be deceptive
- News creates emotional reactions
- Indicators constantly fail
But:
Professional traders do not attempt to predict markets.
This is why Dow Theory has survived for more than a century: